

Page speed is a factor Google uses when determining search rankings. Google’s PageSpeed Insights is a go-to tool for checking your page speed.
Here’s a screenshot of their Report for Noble Intent Studio’s website:

How are Google Lighthouse Performance Scores Calculated?
Things look good for Desktop, with a Performance score of 93.
Digging deeper, here is how our Desktop Performance score was calculated in Google Lighthouse:
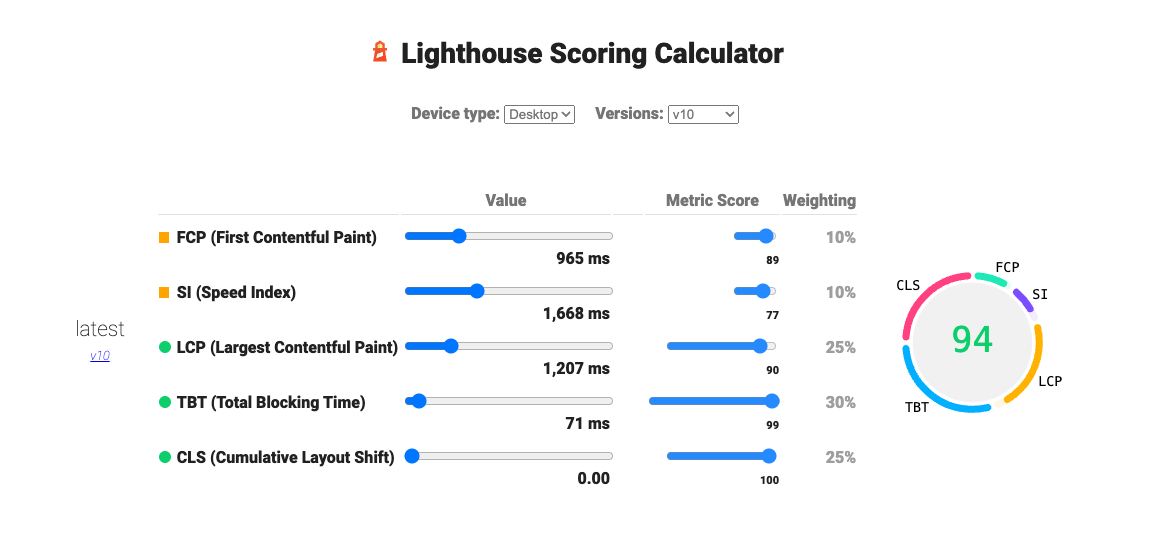
The FCP (First Contentful Paint) is 10% of the total score’s weight.
Our home page clocked in at 965ms so we scored 89/100. A good FCP time is less than 1.8 seconds/1,800ms.
FCP measures how long it takes the browser to render the first piece of DOM content (images, non-white/canvas elements, and SVGs) after a user navigates to your page. Anything inside an iframe isn’t included.
The SI (Speed Index) is 10% of the total score’s weight.
Our page loaded in 1,668ms so we scored 77/100. A good SI time is less than 3.4 seconds/3,400ms.
Speed Index measures how quickly content is visually displayed during page load.
The LCP (Largest Contentful Paint) is 25% of the total score’s weight.
Our page clocked in at 1,207ms so we scored 90/100. A good LCP time is less than 2.5 seconds/2,500ms.
LCP measures when the largest content element in the viewport is rendered to the screen. This approximates when the main content of the page is visible to users.
LCP scores can vary from page to page on your website. They also depend on how much traffic your website gets, your server response, and other factors.
The TBT (Total Blocking Time) is 30% of the total score’s weight.
Our page loaded in 71ms so we scored 99/100. A good TBT time is less than 200ms.
TBT measures the total amount of time that a page is blocked from responding to user input, such as mouse clicks, screen taps, or keyboard presses.
The CLS (Cumulative Layout Shift) is 25% of the total score’s weight.
Our time was 0, so we scored 100/100. Google doesn’t want to see any cumulative layout shift at all, so 0 is the goal here.
Have you ever been to a website and tried to click on something, only for the entire page to shift as more elements load causing you to click on something you didn’t intend to? That’s called “layout shift”.
CLS measures how long it takes for everything to load and the whole page to stop moving. Your CLS score should be less than 100 milliseconds as well, or nearly undetectable to a user.
You can adjust different components of the score with this calculator to see how different inputs would affect the score.
Page Speed Scores Simplified
Page speed scores in Lighthouse can be confusing, and checking one page at a time would be time consuming or near-impossible for a website with many pages.
Zelolab’s Page Speed Audit combines Google Lighthouse’s scores (desktop and mobile) to show them at-a-glance. You can view Performance, Accessibility, Best Practices, and SEO scores in one simple view.
Here’s a preview showing how you can see all your website’s pages in Zelolab’s full-site dashboard and sort your pages by speed scores. There are 10 scores shown—5 for mobile, and 5 for desktop including: SEO, Performance, Accessibility, Best Practicies, and the Average of these scores.
You can sort by the Average. From here, you can address pages that have lower scores, and continue to track scores as you update pages.


Make Websites Better With Zelolab.
View social share previews, page speed scores, and page link statuses across your entire website.


